You might own more Microsoft, Apple, Google and Exxon than you think

Many investors are looking for well diversified investment portfolios and most own the S&P 500 index in their retirement accounts. Investors should however beware that standard S&P funds or ETF’s like SPY are market cap weighted, meaning that the bigger a company is (its market cap) the more of its shares are in the index. For example, recently Apple was 4+% of the SPY, however Apple is only 1 of 500 companies in the index. Today the top 10 (of 500) companies in the SPY account for over 18% of the index. This may not be the diversification you are looking for.

Here is a great tool from Finviz.com that displays the cap weighting of the S&P Index.

SP Map

There are other choices for the S&P 500 that are market weighted, like the Guggenheim S&P 500 Equal Weight ETF (RSP). This ETF has been around for over 10 years and is a very safe investment. Whereas half of SPY’s total capitalization is made up of mega-cap stocks (companies with market values in excess of $200 billion), these giants only make up 11 percent of RSP’s line-up.

Here is a comparison of the holdings between the two ETF’s.

SP vs RSP

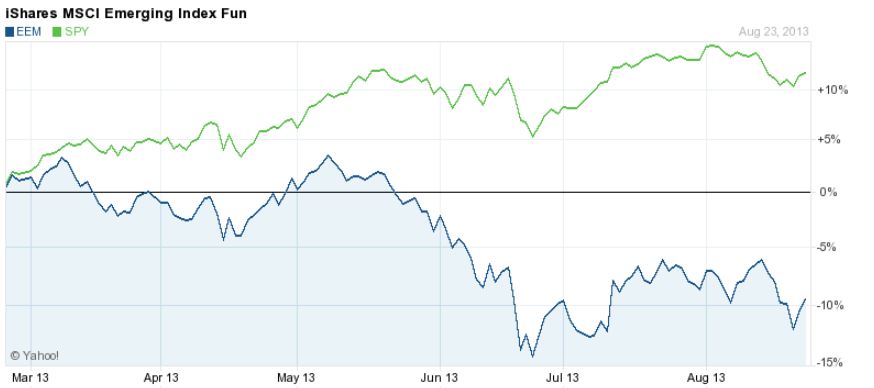
Also the RSP has consistently outperformed the SPY (S&P 500 index), see below.

SP chart-1

What Boxes are Your Investments in?

In a previous post I discussed the need to re-balance your portfolio on a regular basis. One of the first steps to doing this re-balance is to first determine the make-up of your current mix of investments. There are a variety of free tools that let you accomplish this. In this post we’ll talk about the “9 Boxes” or Style Box popularized my Morningstar.

The Style Box will allow you to visually map your portfolio into the 9 categories of:

    • Large value
    • Large blend
    • Large growth
    • Medium value
    • Medium blend
    • Medium growth
    • Small value
    • Small blend
    • Small growth

The horizontal rows represent “valuation” and the vertical columns represent market cap. Here is an example comparing a portfolio to the Dow Jones US Total Market Index.

9 Boxes Example

As a point of further reference let’s compare the above example with the Market Barometer on Morningstar’s web site today (August 29, 2013).

9 Boxes Example-2

In this comparison it shows that in the last 3 months and 12 months small cap stocks, ETF’s and mutual funds have out-performed the large caps. Therefore we might want to consider re-balancing some of our portfolio into small or even mid-cap investments.

Buy and Holding Becomes “Buy and Forget”

We all remember the old adage regarding investing, Buy and Hold. The theory is that you just buy good companies and hold onto them forever. Unfortunately, what happens many times is “hold” turns into “forget”. The buy and hold concept also assumed that you adjust and reallocate your portfolio from time to time. However, most people don’t and in many cases they don’t even know how to. Adjust or reallocate means selling under-performers and adding new opportunities.

Advisors use to suggest that you reallocate your investments on an annual basis.  This however may not make sense, what is so special about any single anniversary date?

So what should you do? My suggestion is to do an extensive review and adjustment to your portfolio on a quarterly basis. Stop putting money into down-trending stocks/funds or ETF’s. For example, on January 1st this year the emerging markets (ETF: EEM) looked great, even outperforming the S&P. However by March it was tumbling and by using the “Buy and Forget” model you would be down 10% while the S&P advanced 10%, a 20% spread.

In future blog postings I’ll give you some tools and ways to better manage your investments.

EEM vs SPY