Beware Congress may “kill – off” the “Stretch IRA” for your Heirs

Stretch IRAIn my last post I discussed Understanding Death and Taxes – Your Taxable Account . I also mentioned there was a big difference between investments inherited in a taxable account vs. an IRA or 401K account.

Currently if you bequeath investments held in a traditional IRA or 401K account your heirs will have to pay tax on the account(s). Currently the holdings are drawn down over a lengthy period of time and taxes areas this occurred, hence the term “Stretch IRA”.

If Congress kills the Stretch provision, your heirs would have to draw down the investments over 5 years and probably get hit by very large tax bills (drawdown plus their normal income). The Whitehouse tried to eliminate the Stretch in 2013 and again this year. Sooner or later this may get eliminated.

What might you do to anticipate leaving your heirs with a huge tax burden?

  1. Consider withdrawing money from your IRA to live on instead of the conventional wisdom of withdrawing from a taxable account. Maybe calculate out the amount that will still say keep you in the 25% tax bracket.
  2. Consider converting some of the IRA to a ROTH IRA (which is never taxed). Yes you again will pay taxes on the conversion but your heirs will pay less.
  3. Consider purchasing life insurance so that your heirs can use the proceeds to pay tax bills.


5 Simple Reasons to Sell an Investment

In my last posting “The Easiest Way to Lose Money in the Market – Selling” I discussed how the average investor unfortunately sells when stock prices are dropping and panic sets in.

There are however some simple rules that you can use to determine when is a good time to sell an investment, including stocks, bonds, funds or ETF’s. These rules aren’t for day traders; they are for long term investors.

  1. Rebalancing. Investors need a plan that includes diversification. The larger the portfolio the more diversification makes sense. Let’s say that you determine Healthcare should be 10% of your portfolio. At the end of a quarter you review your holdings and see that your Healthcare has gone up so much that it is now 15%. This is just too high and you decided to sell some of your holdings in this sector and “rebalance”.
  2. The Story Changes. You always need a specific reason to buy or sell a stock. I started buying Airline stocks in early 2014 when I saw that oil prices were dropping and each of my airline stocks had a unique story. American Airlines was bought by US Airways, Delta bought a refinery in Philadelphia, JetBlue announced a restructuring. At the same time I started selling my Utilities in late 2014 to lock in my gains as it became clear that the Federal Reserve would start raising rates in 2015 and Utilities would not be a good place to be for the next 12 months.
  3. Look at the Technical’s. Technical’s refer to stock charts. It is really important that you know how to read and understand stock charts. If you are a long term investor you might want to look at the 12 month “daily” chart. On this chart you can plot the following comparisons:
    1. 50 day EMA (exponential moving average), this is 2 trading months
    2. 200 day EMA, this is roughly 10 trading months
    3. SPY, the industry standard ETF normally referred to as “the market”

Death Cross

Here is an example of a strong selling indicator, a “death cross”. One of my past holdings was AEP, American Electric Power, one of the largest and best run utilities in the country. In the last few days AEP’s stock price ( had a “death cross”, a clear broken trend. The 50 day EMA (black Line) crossed below the 200 EMA (green line). In addition, AEP (blue line) was already trending below the overall market SPY (purple line). Sell, sell, sell! 

4. Play with House Money. When you make a lot of money in a speculative stock, sell some on an “up day” to take some profits. This is especially true in a tax sheltered account like an IRA or 401K plan. Jim Crammer always preaches this.

5. Moves by the Federal Reserve. Never fight the Federal Reserve, as the saying goes, it will bite you in the backside. The upcoming rate hike by the Fed has been telegraphed now for almost a year. This means that most interest rate sensitive stocks or bonds will get hammered. Sell your bonds now, they are already dropping in price and you will lose much more in principal that the very small dividends they pay.


The Easiest Way to Lose Money in the Market – Selling

The average American spends more time researching what’s on TV tonight or their favorite team’s upcoming schedule than their investments. Some do what I call “buy and forget”, others listen to friends and own the latest fad stocks, and finally there is the group that trust someone else to make decisions like financial advisors.

The biggest reason people lose money in their investments isn’t due to a recession, the Federal Reserve or a “bear market”.  The reason they lose is really simple, they sell low! It is impossible to “time” the market, all the experts and talking heads on CNBC have no idea whether the market will go up or down in the short term. Short term being a day, a month or a quarter. In the longer run, stocks always go up, you just need to be patient and do a little homework. The problem isn’t as much buying high, it’s selling low based on your panic.

Take a look at the attached chart, it shows the market over the last 12 months (SPY is the S&P 500 ETF, commonly referred to as “the market”). The blue line is the SPY, the red line shows the 50 days moving average of the stock’s price.

Market

It is easy to see that people who sold their stocks or funds in a panic, lost money. You can use any stock choice you want, the analysis is the same. You are your worst enemy, you sell or switch funds when the market goes down. I really pity the people who sold their stocks in 2008-2009 at the low points when the stock market was demolished. They then sat on cash, CD’s or bonds and missed one of the greatest rebounds in stocks in our lifetime. Along with your homework, time is the most important factor in your ability to make large returns on your investments.

Want some proof? Warren Buffet is currently worth about $73 billion is 84 years old. He made $70 billion of that after he turned 60 years old.  Your wealth will grow exponentially if you just follow some simple rules and don’t panic! Warren buys and sells based on fundamentals and investing in value. He buys low and sells (or holds) when the price is high.

In my next blog post I’ll give you some ideas when to buy and when to sell your investments.

My Top 5 Explosive Growth Stocks for 2015

GrowthEvery diversified portfolio needs an allocation of explosive growth or momentum stocks. These tend to be volatile and should have a great growth story behind them. You can’t pick these stocks based upon a single day or even a month’s performance. They also have a life span that is somewhat governed by technology or major market themes.

Ambarella (AMBR) This is a video chip company whose products are used in the leading wearable helmet camera GoPro (GPRO). They are also a leader in automotive backup cameras. It has a huge upside because, beginning in July 2018, all US made cars and light-duty trucks must have backup cameras. In addition they are a leader in ultra-high-definition TV, a next generation TV that we’ll all have someday. Last quarter, their 4th quarter they beat their revenue and earnings forecast. I bought this stock in late 2014 and it is up 60%. It is up 400% in the last 12 months and trades at a 55 P/E, not too bad.

AMN Healthcare Services (AHS) This company provides staffing and staff management services to the healthcare market. Obama Care has put pressure on hospitals and other healthcare facilities to both find qualified nurses and physicians and manage costs. The healthcare market will continue to grow for years to come and this company is well positioned to enjoy excellent growth. They are up over 100% in the last 12 months and trade at a 33 P/E. I first bought this stock in late 2014 and have added to my position a few times when it hit its daily 50-day EMA.

NXP Semiconductors (NXPI) This chip company provides “near field” communications for products including the Apple iPhone and Samsung phones and tablets. This technology is behind mobile payment systems like Apple Pay and competitive brands. They just recently signed up Chinese consumer electronics maker Xiaomi and acquired Freescale Semi in March. Freescale is a leader in automotive chips for keyless entry. The stock is up 100% in the last 12 months and trades at a 80 P/E. I bought this stock in late 2014 and it is up 40%.

Palo Alto Networks (PANW) This company is a leader in enterprise cyber security. This stock is in my basket of cyber stocks that include FireEye and CyberArk. They all have been hot for the last 6-9 months. Cyber threats will continue to be a hot topic for years to come. PANW and FireEye actually lose money but they continue experience substantial growth. PANW is up over 200% in the last 12 months when I started buying it.

Skechers (SKX) This is a shoe and apparel company. When I moved to Florida a year ago I found that I needs more casual shoes that were very comfortable. I bought a few pairs of Sketchers and I love them. After some research I bought the stock and after flat performance in 2014 it has really picked up. I’ve also seen the 2 founders on Jim Cramer’s Mad Money and they tell a convincing story. The stock is up 90% in 2015 and have overtaken Addidas and New Balance to become the #2 footwear provider in the US. The stock trades at a 32 P/E.

Invest in China – My Top 5 Selections

ChinaAs the US economy goes into a slow growth mode I’ve been increasing my exposure to China. Currently my direct China investments only hold a 4% allocation in my portfolio. My goal is to increase this to 6-7% by mid-summer. I’d like to have 15% allocation to the combination of Europe and China. My actual exposure to China is more than 4% because some of my other holdings have substantial China exposure, like Apple (APPL) my largest single holding alone representing 5% of my investments. In the most recent quarter, Apple sold more iPhone’s in China than in the US.

My strategy in China is to go with the sector winners where possible. Here are my picks; all have provided double-digit returns in the last 12 months.

Baidu (BIDU): Baidu is the “Google” of China, it services including maps, news, video and encyclopedia searches. Baidu completely dominates China just as Google does the Western world. Google has only 3% of the China search traffic and 90% of the rest of the world. I’ve held Baidu for a number of years.

Ctrip International (CTRP): Ctrip is the “Expedia” of China. As a matter of fact Ctrip just acquired a 38% equity stake in eLong, a Chinese competitor, some of this stake came from Expedia another investor in eLong. This stock just hit its 52 week high on Friday, up over 100% in the last 12 months. Ctrip’s mobile app has over 800 million downloads and in Q1 about 70% of all of the company’s online transactions were mobile.

iShares China Large Cap ETF  (FXI): This is my catch-all for all the large corporations in China that trade on the Hong Kong Exchange. FXI track the FTSE China 50 Index which includes the 50 largest companies in the Chinese equity market that are available to international investors. It currently is trading close to its 52 week high, yet only has a P/E of 13. It has returned over 70% in the last year. If you are going to only own one Chinese stock, this is the one to own.

NetEase (NTES): NetEase, operates an interactive online community across multiple areas, including Online Game, Advertising, E-mail and E-commerce.  Similar to Yahoo in the US, it offers news, information, community and communication services, such as photo albums, instant messaging, online personal ads, and online video. Their e-mail services are used by a lot of large corporations. It too is now trading close to its 52 week high and has gone up more than 100% in the last 12 months.

Vipshop Holdings (VIPS): Vipshops has a unique on-line “flash sales” business that really doesn’t have an equivalent in the US. I’ve held VIPS for many years and it’s gone through a recent stock split. This is a controversial stock and can be volatile. They are also a regular discount retailer with many of their own brands, maybe like a smaller version of Amazon or WalMart.com. This is probably the riskiest China stock that I own, and my cost is so low that I really don’t want to sell it and pay a substantial capital gains. This stock can easily return 10-15% or more a year and is a great “trading stock” if you have a short-term outlook.

How Not to Invest in the Oil Market – And My Suggestions

Oil StocksMany of you may want to invest in the oil market, betting that the price of oil will either go up or down. It would seem that the most logical thing to do is either buy the United States Oil Fund (USO)  ETF (buy to go long or short the ETF to bet oil goes down). This ETF tracks West Texas Intermediate oil (WTI), and is down about 16% year-to-date after falling about 45.5% last year.

One problem with this strategy is that you may think that the USO, or the similar OIL ETF’s actually owns the oil in the ETF. For example, most stock ETF’s like the SPY actually own the stocks in the ETF. USO doesn’t actually own any oil as such. Furthermore there are fundamental issues with holding these types of ETF’s for long term investors.

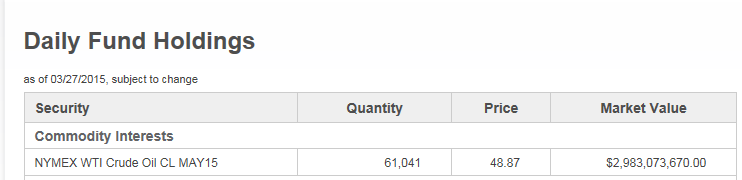
Let me explain. The USO ETF buys “near month” crude oil futures contracts on the NYMEX. Today the near month is the May 15 WTI contract, for which they own 61,041 contracts.

Chart

The problem, as any Futures Trader will tell you, is that every month you need to settle up (sell) your position and in the case of USO “roll” into a new position (buy new contract). A monthly futures contract expires at the end of that month. Each time they do this there are both fees involved along with the fact that they are buying high and selling low during the cycle. This is not a great situation for a “buy and hold” type of investor. This USO ETF is a great short-term “trading” stock with plenty of liquidity (daily volume). Their  ETF expense ratios are well above other equity-based energy ETF’s. For example, USO charges 0.45% per year while OIL charges 0.75%.

“Those costs accrue with each passing month. The United States Oil fund saw comparable demand from investors in February 2009, the last time oil prices imploded. From there, spot crude more than tripled from $34 a barrel in about two years. Yet, investors holding the fund captured only about a third of that,” according to Barron’s.  To further complicate the situation, USO has added over $2 billion in new money this year and most of it “shorting” the fund, rather than going “long” in an inverse oil ETF. These huge short positions make the ETF even more volatile. 

As Barron’s also reports, “As more people get into oil ETFs, new investors should understand the potential risks of trading futures-backed funds. Specifically, oil traders should be aware that USO tracks front-month WTI future contracts and the underlying oil market is currently in a state of contango. Consequently, USO could experience a negative roll yield when rolling a maturing futures contract.”

My suggestion is that you invest in the energy sector ETF’s that hold real stocks, like the SPYDR  XLE or the Market Vectors Oil Services  OIH ETF’s. The XLE holds mostly large cap energy companies like Exxon, Chevron, ConocoPhillips, etc. The OIL ETF holds oil service companies like Schlumberger, Halliburton, National Oilwell and Baker Hughes.

I have no idea whether the price of oil is going up or down in the next few months, but I do believe that this time next year both XLE and OIL will be much higher and their lower prices have already enhanced their now respectable dividends (as compared to bonds and US Treasuries.)

Disclosure, I am long XLE,and KMI.

Don’t Be a Retirement Fool on April 1st

April 1st

If you miss the April 1st date you will be taxed at a 50% penalty rate!

April 1st might be a good day to play a trick on a friend or family member, but if you turned 70 ½ during 2014, April 1st is a very serious date.

For those that crossed the 70 ½ mark, April 1st is the deadline to take your first “required minimum distribution” (RMD) from your tax-deferred accounts like IRA’s and 401K’s. Roth IRA do not require a RMD and therefore there is a planning strategy to convert tax deferred accounts into Roth’s. Keep in mind that the annual requirement for the RMD is December 31st of the same year and only in the first distribution can you delay it till April 1st. Therefore if you wait till April 1st this year, you’ll have to take another distribution for 2015 before December. This in total could amount to a 7% withdrawal from April-December 2015 which for some people is both a lot of money and a potentially large tax bill. Keep in mind that all distributions from a tax deferred account are taxed as “ordinary income”, no special breaks for dividends or LT capital gains. Fidelity Investments reports that over 40% of the people needing to take their first distribution have not done so as of a few weeks ago. The IRS says, “If an account owner fails to withdraw a RMD, fails to withdraw the full amount of the RMD, or fails to withdraw the RMD by the applicable deadline, the amount not withdrawn is taxed at 50%.”

This can get a little complicated, but if you have multiple IRAs, you should calculate the RMD separately for each account – but you can withdraw the total amount from a single IRA. In addition,, if you have different types of tax deferred plans – such as an IRA and 401(k) the RMDs must be taken separately from each kind of plan.

What Type of Assets Go into Taxable vs. Retirement Accounts

It really is a classic question many investors have. How do I decide what type of stocks, bonds and funds to put into my taxable brokerage account vs. my tax deferred 401K/IRA accounts? The overall idea is to reduce the impact of taxes on your investments. There is no “one size fits all” approach and sometimes your allocation depends on what stage of life you are in. I’ll assume in this article that you are over 50 and planning or are in retirement.

Tax Deferred 401K/IRA Accounts:

  1. The strategy is to have higher tax items in these accounts.
  2. Stocks or funds where dividends are taxed as “ordinary income”.
  3. Mutual Funds or ETF’s that have a high beta, or churn. This means the portfolio can have big tax consequences since they typically have short term capital gains taxed as ordinary income.
  4. REIT’s and BDC’s, whose dividend payouts are generally considered nonqualified and taxed at ordinary income tax rates.
  5. Any preferred stock who’s dividends are taxed as ordinary income, i.e. preferred REIT’s.
  6. Trust preferred’s that are taxed as ordinary income.
  7. Dividends from some foreign stocks and funds that are taxed as ordinary income.
  8. Options trading

Taxable Accounts:

  1. Strategy is to have tax friendly assets in this account and also a high degree of control.
  2. All cash for retirement living expenses or an emergency fund.
  3. Growth stocks that don’t pay dividends but will be held for long term gains.
  4. Tax-free bonds and bond funds.
  5. Unless you are looking for a “no-income” approach, stocks or funds with “qualified dividends”.
  6. MLP’s, if held for a long time since most distributions are a “return of capital” until the stock is sold.
  7. Any investment used as a “hedge” such as Gold stocks, inverse S&P etc. since they can be used for an offsetting capital loss at tax time if desired.

ROTH IRA Accounts

  1. This is the best account to hold high tax items in.
  2. It is also probably the safest place to shelter future income since the government has constantly changed tax rates and thresholds on taxable and tax deferred accounts (ordinary income tax rates). It’s hard to believe the government would change the tax-free provisions of the ROTH IRA.

How to Easily Beat 80% of Hedge Funds – Just Buy the Market

You see all the talking heads on TV, explaining how they are long xxx stock and short xxx stock. They toss out complicated terms like forward EPS, tangible book value and so forth. Many have analysts on the payroll to help them pick the very best investments. Yet in 2014 about 80% of Hedge Funds are reportedly underperforming the overall all US market, namely the S&P 500 index (SPY). SPY is an ETF sold by State Street Advisors that is commonly referred to as the “market”.

Just to clarify a common misconception, many investors think the Dow Jones Industrial Averages “the Dow” is “the market”. It isn’t predominately because it is a very small sampling of 30 very large companies. In addition it is know as a “price weighted” average. This means that a 1% change in a $100 stock has twice the imp[act as a 1% change in a $50 stock. Therefore, if IBM at $155 and Visa at $258 have bad days the Dow average will be down sharply, but the overall market could be up nicely.

Today it is really easy to have a “market performing” investment portfolio, just buy the market. Arguably the great investor of all time, Warren Buffet suggests that people who don’t want to take the time to actively manage a portfolio just buy the S&P 500 Index. The S&P 500 Index is actually 501 stocks, and 500 companies. It just so happens that Google is listed twice due to a split into type types of shares for the same company (voting and non-voting).

If you put all of your investments in just the SPY ETF or the Vanguard S&P Index ETF “VOO” you would have made over 14% in the last 12 months. In addition you would have collected 1.9% in dividends.

SPY


You can choose either fund, it just so happens that VOO has a smaller annual expense fee of 0.05% vs. the SPY at 0.09% expense ratio. If you had a $1,000,000 investment the SPY ETF would costs you $400/year more in fees than the VOO.

If you want to beat the Hedge Funds and most other investment managers, it is simple, just invest in the “market”.


How to Measure Your Stocks – A Simple Technical

We all have investments in both taxable and tax deferred accounts. Many people however are unsure exactly how to measure whether their stock or fund is doing well or not. Professional investors have dozens of tools by which to judge performance, I’ll just show you a simple one.

This measurement is to compare your investment to the S&P 500 Index, commonly referred to as “the market”. The S&P 500 is made up of the 500 largest companies listed on the NYSE or NASDAQ stock exchange. When you hear comments like a stock or fund “beat” the market, it normally refers to its performance against the S&P 500.

One simple and common measurement to judge the performance of your stocks is to compare it to the overall market, and then look at a comparison to its own “moving average”. I like to use both a 50 day and 200 day MA (moving average). The moving average quickly shows growth or decline over a longer period of time.

 We’ll look at two stock charts. The first chart is for one of my favorite holdings, Kroger (KR). It is almost the perfect stock from a “technical” point of view. In stock lingo, “technicals” refer to the analysis techniques from a chart. “Fundamentals” by comparison refers to looking at a stocks PE, beta, PEG ratio, last earnings report and so forth. Yahoo Finance has a simple easy to use chart capability.

 Kroger


This chart shows Kroger’s has substantially outperformed the market over the 12 months. In addition it has consistently stayed above its 50 day and 200 day moving average, the price keeps going up in a nice smooth, consistent way. Also notice that the gap is widening between the 50 and 200 day MA, the rate of growth is increasing. In the last 12 months the S&P has gone up 9.64%, and Kroger has gone up 82%.

 The next stock is Goldman Sachs (GS). I bought GS on August 7th at $183.90, just after the 50 day MA crossed above the 200 day MA, it looked like the stock was on the rebound and would outperform the market. Last week they reported disappointing earnings and the stock has slid down every day since. It finally crossed the 200 day MA and I sold it this morning for small loss. Part of my decision to sell was that almost all of the big banks and financial services companies are reporting weaker than expected earnings and the entire sector looks in trouble for at least the 1st half of 2015. I also own a position in Morgan Stanley (MS), it too dropped but only below the 50 day MA, not the 200 day.

Goldman


Comparing your investments to the market and their own moving averages will help you determine if you have chosen the right investments in your accounts. In a future post I’ll give you a few more things to look for.