
Not to be too picky, but the actual high was 5049. To refresh your memory, when the NASDAQ hit its high it held it for just 31hours before it dropped 80% over the next 2 ½ years. Will the same thing happen again in 2015?
I don’t think so for a number of reasons. This is why things are different, even though both the Dow and S&P are at all time high’s. First of all, in 2000 the NASDAQ traded at 100 times earnings (P/E) multiple, today it trades at about 21, only slightly higher than the S&P 500 18 x earnings. Secondly, Apple accounts for almost twice the market weight of the next biggest stock. Apple is probably one of the most financially sound companies in the world. By the way, Apple only trades at a 14 P/E, far less than the overall market. Of the 240 point rise in the S&P this year, Apple accounts for about 130 weighted points of the increase. A good reason that the number 1 stock in all equity hedge funds and equity index’s is Apple (APPL).
You might be interested in the difference between the top company’s then and now, just check out the “bubble” P/E’s of 2000.
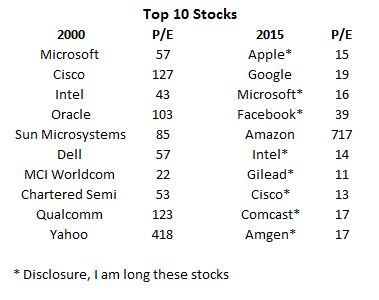
Things look a little different, however Amazon sure looks like a 2000 bubble stock!
