
Each year as part of my year-end evaluation of my different portfolios I study the Periodic Table of Performance. This table is most helpful in my Fixed Income IRA portfolio that I will use to cover my income “Gap” when I start taking Social Security next year at age 70. To learn more about calculating your “Gap”, just click here.
In this Fixed income portfolio I’m looking to balance dividends vs. risk, my current portfolio generates 7.81% average returns.
Here is the Periodic Table of Performance provided by Alerian:
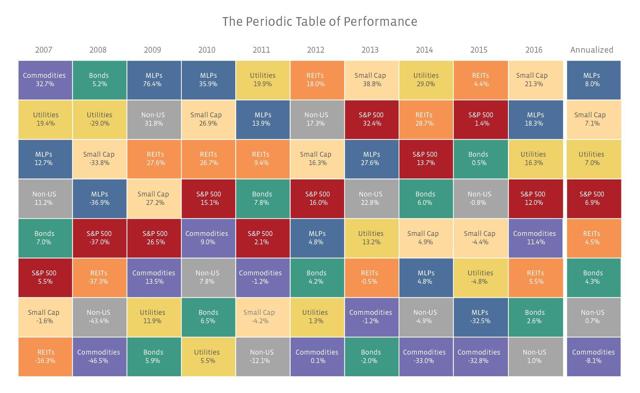
The table is comprised of the following benchmarks:
- MLPs are represented by the total return version of the Alerian MLP Index (ticker AMZX)
- Utilities: S&P 500 Utilities Index (a composite of utility stocks in the S&P 500)
- Commodities: S&P 500 Total Return World Commodity Index
- Bonds: Barclays US Aggregate Total Return Bond Index
- REITs: Real Estate 50 Index (a supplemental benchmark to the FTSE NARIET US Real Estate Index Series)
- Non-US: MSCI Daily Total Return EAFE Index
My IRA Fixed Income portfolio has the following sector allocations:

Over the last several months I have made a few adjustments to my long-term holdings.
I’ll publish an updated list of my holdings in a future post.
